While I have been looking for good infographics, I have also run across a few bad ones as well. Here are just a few.
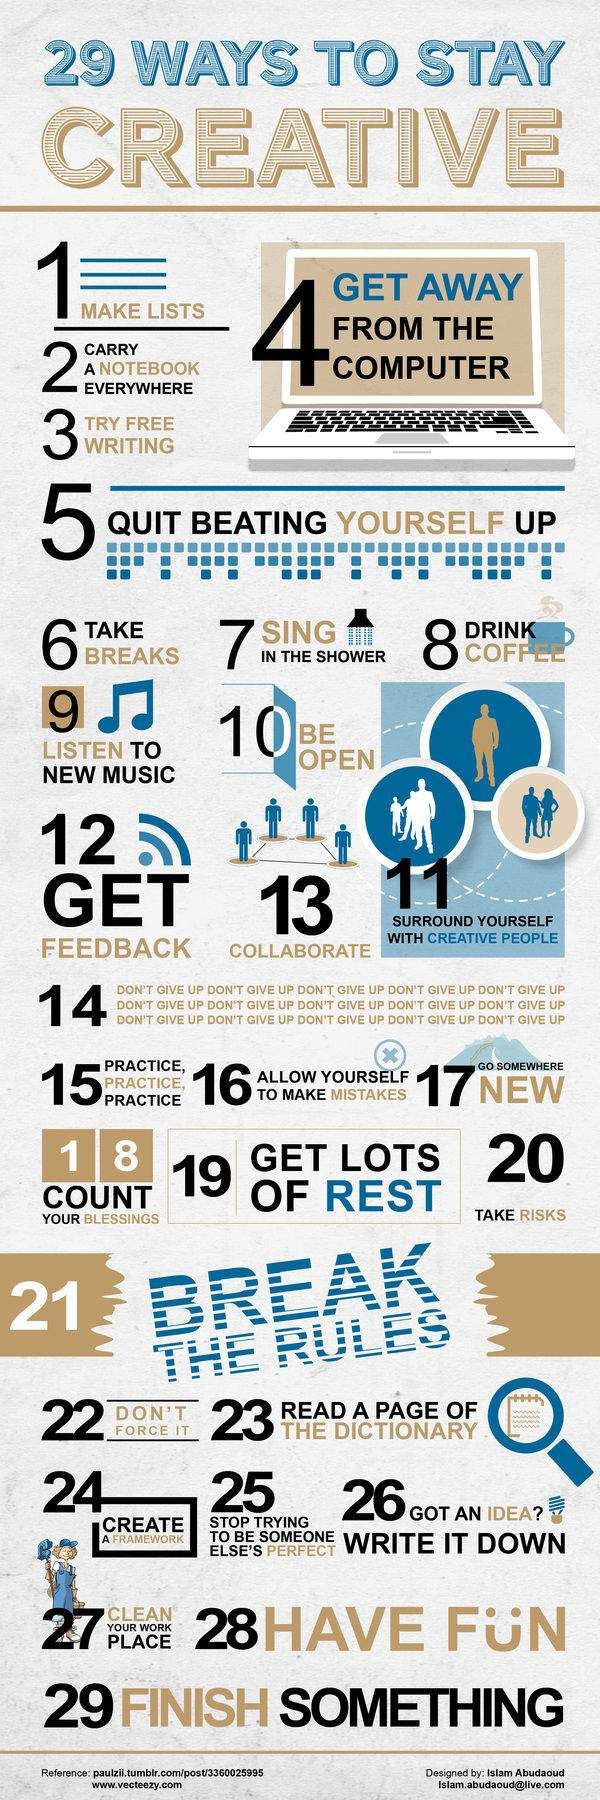
- 29 Ways to Be Creative made by Islam Abudaoud and can be found on http://www.browneyedbaker.com/friday-things-72/
The data is represented with numbers, words and a few simple illustrations. I think this infographic is unsuccessful because nothing really draws you in. The colors are dull, there is a lot on information packed on one page, and the hierarchy competes between the numbers and the actual words. All the illustrations are simple until you get to number 27.
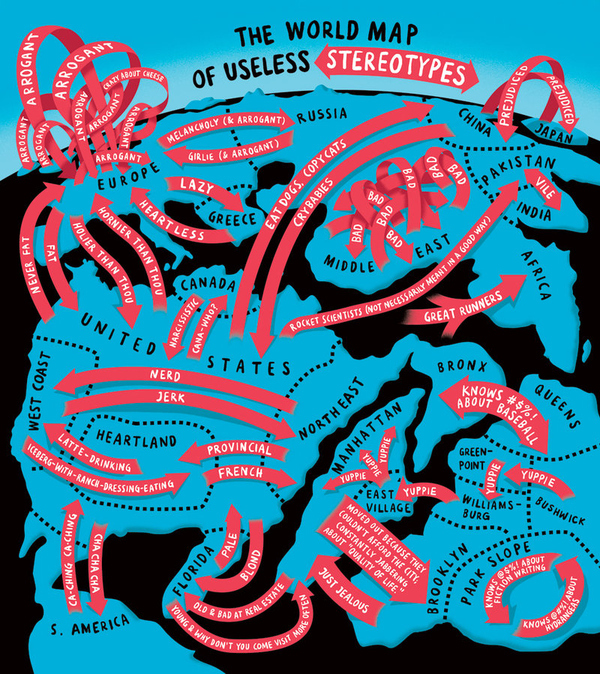
2. World Map of Useless Stereotypes made by Christoph Niemann and found on https://niemann.blogs.nytimes.com/2011/07/06/the-world-map-of-useless-stereotypes/?_r=0#
I love the colors of this infographic and the idea behind it. I think this is unsuccessful because it is hard to read and hard to follow. I don’t know where to start. It is also not an accurate map.
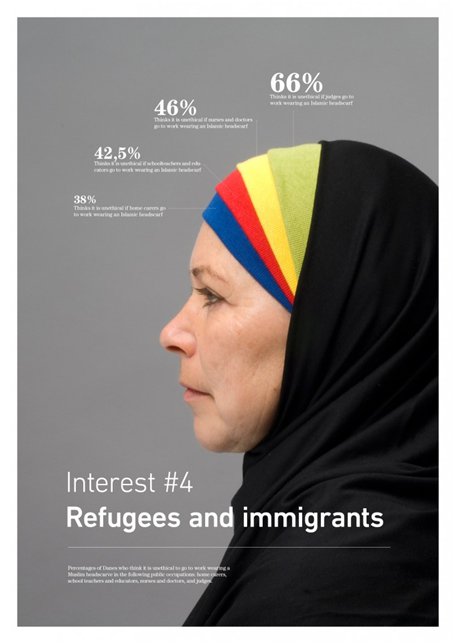
3. Refugee’s and Immigrants found on https://www.seo.com/blog/infographics-vs-infocrapics-the-good-the-bad-the-ugly/
I like the idea behind this infographic. Unfortunately, the data doesn’t add up. That is the only thing making this an unsuccessful infographic.
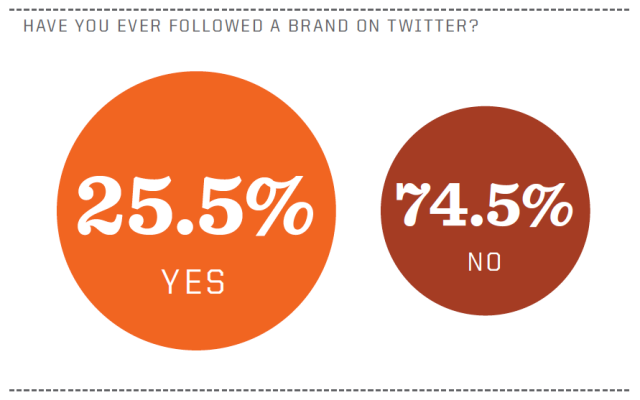
4. Have You Ever Followed a Brand on Twitter posted on http://adesigndive.blogspot.com/2010/11/show-and-tell-infographics-good-bad.html
This is an unsuccessful infographic. The numbers add up to 100% but the circles are the wrong size. The 25.5% should be a smaller circle than the 74.5% because the number is smaller.
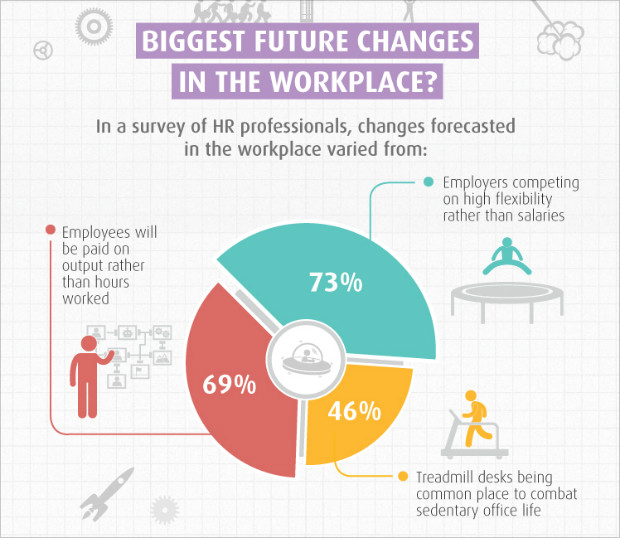
5. Biggest Future Changes in the Workplace found on http://blog.visme.co/bad-infographics/
This infographic is unsuccessful because even thought the portions are in some sort of hierarchy the numbers do not add up to 100%. It adds up to 188%. This makes a false pie chart. The colors work well and the illustration is simplified but the data is incorrect.